Dimensional Error Table Updated! |
Home | ||
| After a
dimensional analysis all dimensional errors are listed, sorted and grouped. A graphical
display illustrates how the errors are distributed to give a complete picture of the
accuracy of the drawing. The DET is activated by picking the "BAD" field of the dimensional analysis area in the Accuracy Advisor main menu. |
|||
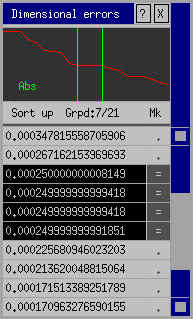 |
Functions available in DET Graphical display By indicating a point on the error curve the system will highlight any dimensions having that particular error. In the case shown here there are 4 dimensions all in error by approximately 0.00025. Each time a dimension is highlighted with the DET the graphical display will update to show you the significance of the error in question. The graph can display absolute or relative error values. Highlighting You may be interested in locating the dimension with the biggest error. This is possible by picking the right-hand field of the largest error value. The dimension in question will then be highlighted. |
||
Adjusting By picking the left-hand field the usual adjustment function can be initiated. The adjustment arrows will appear without you having to locate the dimension. Grouping Because errors of the same value will usually be related, similar sized errors are grouped together by the DET. By picking the "=" field, all the dimensions with this error will be highlighted. This makes it possible to deduce the common origin of errors for several dimensions simultaneously. By using the adjustment facility on the common element of the grouped errors, drawing accuracy can be improved very quickly - and correctly. Picking the field that displays the number of grouped errors highlights all the groups independant of the error size. |
|||